|
This technical information has been contributed by
Futek Advanced Sensor Technology, Inc.
Click here to find suppliers


IEEE 1451.4 STANDARD AND PRACTICE
Sensor Measurements: Making Sense of Numerical InformationMario Orizabal
Electrical Engineer FUTEK Advanced Sensor Technology
futek@futek.comABSTRACT In the practice of sensor measurements making sense of numerical information becomes an important factor in the usability of the sensor itself. Typical sensors output a given voltage or current as a direct relationship to the load. This load can be force, torque, pressure or temperature. The outputs given by sensors are typically raw numerical information. This information is typically useless and must be converted to a standard engineering unit. Once this conversion takes place we can start making sense of how these forces interact in a system under test. These raw voltages can be also ratiometric, meaning that output is proportionally affected by excitation voltage. Outputs can also be absolute, meaning they are not dependent on excitation voltages.
SENSOR TECHNOLOGY Sensor technology reaches a broad spectrum of different technologies such as piezoelectric, thermocouples, capacitive or strain gage. Forces that are being measured produce either small voltages or changes in impedance or resistance. A typical sensor carries a specific voltage at a specific given load, which is typically called Full Scale Output at that specific range. The Full Scale Output usually will correspond to an engineering unit for that specific application. The only way of finding that Full Scale Output is to perform a load calibration on the sensor. Sensors are typically not adjusted, but can be adjusted, to a specific value. Typically the calibration number is determined by whatever value the sensor outputs at a specific load. Calibration numbers can also be given as percentages of Full Scale Output. A calibration certificate is then generated that will list the calibration number or a series of points delineating the sensor characteristics.
CALIBRATION OF SENSORS A sensor by itself does not give useful information. Typically the sensor is interfaced through a variety of means such as a panel display or data acquisition system. The displays will then proceed to convert the raw data to engineering units. A data acquisition system will allow collection of raw data. The panel display uses the front control buttons to enter the desired information, whereas a data acquisition system will require control software. In the panel display, for example a scaling factor or two point mapping is entered to produce an output in a desired engineering unit. In either case the sensor output is linearly scaled using a
Y = mX + b function
In special cases in which a sensor has a more pronounced non-linear output (such as thermocouples), either higher order functions are implemented, or piecewise linear or polynomial interpolations are performed. A sensor and display work as a system, therefore they cannot be interchanged without affecting calibration. Factors that affect display calibrations are:
The amount that the display calibration will be affected is dependent on the tolerances on the displays. In some cases the change may be acceptable. But in applications where traceability is important, the slight change could affect the process, and disqualify a test.
- Changing wire lengths by cutting.
- Swapping with different displays.
Different scenarios exist in sensor and display systems.
The first scenario is the most cost effective, but also the most prone to error. Depending on the type of connection (Typically Pigtails) continuous connecting and disconnecting will eventually lead to breaks in the cables and reduced lifespan of screw terminals. The second scenario is the most convenient, but also the least cost effective method. But again this depends on the application at hand. In a test laboratory, the first method would be the best choice, but in an assembly line, the second scenario makes more sense.
- Multiple sensors and one display.
- One sensor and one display for each system.
Several problems exist in the assembly line environment when dealing with calibration periods. Calibration periods may span from every few months to several years, depending on the usage and type of technology. In order to perform a calibration and system setup, the entire system must be sent out to a metrology laboratory. This may be time consuming and if a back up is not available it may stop production all together. Another problem that could occur is damage to the sensor. As an example, a force sensor can be easily damaged through overloading. In order to replace a damaged sensor, a new sensor must be reconfigured, with all new calibration parameters entered onto the display. This entry must be performed by a trained technician and can be prone human error, which may not be caught until a sensor is well into production.
INTRODUCTION OF PLUG AND PLAY SENSORS In order to address several of the issues introduced so far, the IEEE organization developed a series of standards known as the 1451 standards. Typical sensors are mostly concerned with the 1451.4 standard which applies to most passive and active sensors. The objectives of the standard are as follows.
There are two classes of plug and play Mixed Mode Interfaces.
- Provide a common plug and play platform and compatibility with legacy sensors. [1]
Class I which uses a power supply line to share digital signals. Class I requires the use of specialized hardware that can switch between digital and analog modes. This is the most difficult to implement, but requires the least amount of connections.
Class II uses two (data and ground) separate lines for digital transmission of information. Class II requires separate analog and digital transmission lines and is easier to implement, but requires the most connections.
The IEEE 1451.4 standard does not define physical connections. Although various manufacturers have come up with common interfaces which may become de facto standards as the standard becomes widely used.
TEDS The heart of IEEE 1451.4 standard is the TEDS (Transducer Electronic Data Sheet). TEDS contains pertinent information regarding the sensor in question. Information such as serial numbers, calibration dates and scale factors are included in TEDS. TEDS are typically stored in EEPROM memory that can be altered and changed. This is required due to periodic recalibration cycles for the sensor. The basic hierarchy is as follows. The TEDS consist of a primary set of information called "Basic TEDS" which is comprised of 64 bits of information.
[2]
BASIC TEDS
Field Description
Bit Size
Range
Manufacturer ID
14
17-16381
Model Number
15
0-32767
Version Letter
5
A-Z (Non Ascii)
Version Number
6
0-63
Serial Number
24
0-16777215
Due to the limited size of TEDS memory, these bits must be compressed and optimized to fit in to the required memory locations. Typically digital systems store information in bit sizes of 8 or 16 bits. TEDS however can have data from as little as 1 bit. This proves to be a programming challenge since computers process data in powers of 2n beginning with 8 bits. This requires careful parsing of data to extract the required information. The Basic TEDS also only supports numerical serial numbers. The Basic TEDS must be included in every sensor.
Extended templates are also available for various types of sensors, such as accelerometers or Wheatstone bridge type sensors. These templates carry more information that can be used to describe the sensor.
Bridge Sensor Template 33
Description
Bits
Data Type
Units
Template ID
8
Integer
-
Electrical Signal Type
0
Bridge Sensor
-
Select Units
6
Select Case
-
Min. Physical Value
32
Single
Any
Max. Physical Value
32
Single
Any
Select Precision
2
Select Case
-
Case 0
Min. Electrical Value
11
Constant Resolution
V/V
Case 0
Max. Electrical Value
11
Constant Resolution
V/V
Case 1
Min. Electrical Value
19
Constant Resolution
V/V
Case 1
Max. Electrical Value
19
Constant Resolution
V/V
Case 2
Min. Electrical Value
32
Single
V/V
Case 2
Max. Electrical Value
32
Single
V/V
Mapping Method
0
Linear
-
Bridge Type
2
Enumeration
-
Sensor Impedance
18
Constant Resolution
Ohms
Response Time
6
Constant Relative Resolution.
Seconds
Excitation Nominal
9
Constant Resolution
Volts
Excitation Minimum
9
Constant Resolution
Volts
Excitation Maximum
9
Constant Resolution
Volts
Calibration Date
16
DATE
-
Calibration Initials
15
CHR5
-
Calibration Period
12
Unsigned Integer
Days
Measurement Location
11
Unsigned Integer
-
The extended template set gives more detailed information regarding the sensors. Some of the data types are straight forward. However, Constant Resolution and Constant Relative Resolution work in a different manner. These data types are mappings, rather than data types such as single precision or integer variables. Constant Resolution is a linear mapping of data.
Excitation voltage is defined as Constant Resolution at nine bits. Nine bits provides 29 for 512 steps. It begins from 0.1 to 51.1 in steps of 0.1 Volts. (51.2 / 512 = 0.1).
Constant Relative Resolution is a logarithmic mapping, which does introduce mathematical rounding errors. For Response Time it's defined as Constant Relative Resolution at 6 bits with a StartValue of 1e-6, Tolerance of 0.15. Where
Value = StartValue * (1 + 2 * Tolerance)BitsValue BitsValue is the integer value of information stored in the bits. For a six bit number it equals to 32 possible steps.
All this information can be used to automatically configure any piece of instrumentation that supports TEDS. By using information such as Minimum and Maximum Physical and Electrical Value, we can compute a scale factor and correct for any offsets. The amount of configuration though will be dependent on the type of instrument and its limitations. Some instruments may allow automatic adjustment of Excitation Voltage. There are however some limitations with the TEDS template. Only 64 pre-defined units are allowed. The standard templates will not allow other units besides those that have been defined. Also instruments may have other settings such as resolution settings that are not supported by the standard templates. The user however is free to store any data in the user area of a TEDS memory. The user area is any memory left over after storing the primary templates. Be aware that since the user area is arbitrary, other instruments will not recognize the information. This means that the user info will only be recognized for a particular instrument that it was programmed with.
The TEDS standard does allow custom templates to be created by using the TDL (Template Description Language) language. This language is a descriptive language, rather than functional language such as C++. But it allows the user to define any template as needed. The idea behind the language is that the description file would be stored in a TEDS device and automatically parsed when encountering a TEDS sensor with that particular template. The TDL files are stored in text format. However due to limited memory in small displays, storing the actual template definitions is not feasible, making more feasible to hard code the needed templates. For this reason, it is ideal that once a template is defined, that it is not changed. This is especially critical if initial template drafts have already been deployed. Under ideal conditions a TEDS device should be able to read any template. Any new templates would simply be loaded by uploading the proper TDL file.
TEDS enabled sensors will simplify configuration of displays and other data acquisitions systems. A damaged sensor would simply be replaced and plugged in without having to change settings. This is an ideal solution for laboratories that use different sensors on a daily basis. For recalibrations, the calibrated sensors would have the latest TEDS data entered in from the metrology lab, ready to plug in.
HARDWARE ISSUES AND LIMITATIONS One issue discussed is that connections are not standardized. Manufacturers will have to come to an agreement on the type of connections and configurations. Plug and Play is useless if all manufacturers have their own connection codes and risk damaging their devices. Also TEDS memory is limited. For example a common memory device used is the Dallas 2433 chip. It is 4 kilobits in size (512 bytes). The templates should carry just the necessary information for a particular sensor. These devices are simple to implement because they just require two wires for communication. But because they are also semiconductors they can easily be damaged by over-voltages and ESD. Proper precautions need to be taken. These memory chips can be networked and can be read by specialized hardware, or simply by I/O ports of any microcontroller or microprocessor.
One issue, not that it is not readily taken care of in TEDS, is that of the calibration of sensor interface devices such as panel displays. Let's take the case of a factory that leaves its instruments behind and sends its sensors to be re-calibrated. The calibration lab has its own instruments. Those instruments may not necessarily be in perfect calibration to the instruments in the factory. And this will be dependent on the type of instrument and quality. If the lab instrument is accurate to 0.01% and the factory instrument is accurate to 0.05% then we would see some discrepancy. In this situation the factory may live with the error, but in certain applications accuracy may be very important. A factory that is filling soda cans has different requirements than a factory that is installing delicate components on a biomedical device. Even devices within the same model can have discrepancies between them.
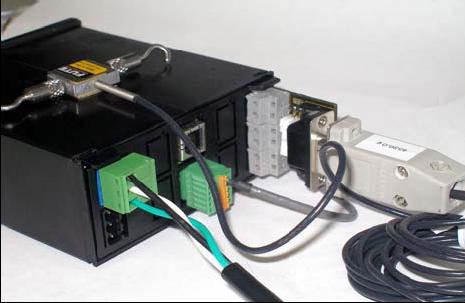
.......... COMMERCIAL TEDS INSTRUMENTS The Futek IPM500 display uses a microcontroller controlled TEDS reader: the IAC500 Figure 1, that simply plugs in as a peripheral. This means that legacy panel meters can be easily upgraded to support TEDS. The TEDS reader card provides both USB and RS232 support, which allows interfacing to any SPC software or PLC device.

Figure 1Interfacing with sensors simply requires connection to a male D-sub 9 connector and installing a memory chip. In Figure 2 a Futek LSB200- 10 lb S-Beam load sensor is interfaced with Dallas 2433 4Kbit chip and male D-sub 9 connector.
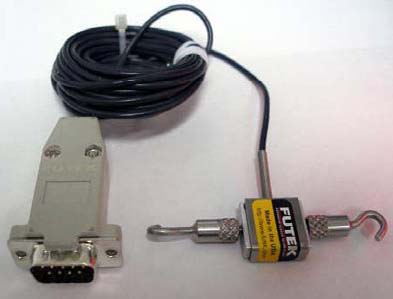
Figure 2Connector kits are available for upgrading any non-TEDS sensor. The IAC160 Figure 3 is provided to interface to the IPM500 panel display. The IAC160 contains female D-sub 9 connector and Molex header to interface TEDS to the panel display.

Figure 3A typical configuration is shown in Figure 4. Upon connecting in the TEDS sensor the display automatically goes through a configuration cycle. In this cycle the Manufacturer ID and Template ID are temporarily flashed on the front panel before the display goes through a reset routine and begins showing the actual readings.
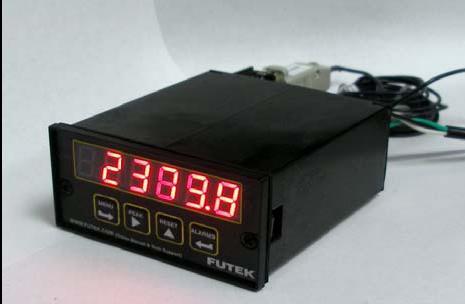
Figure 4When a new sensor is plugged in, a new cycle is initiated and the display is updated with the unique calibration factors extracted from the TEDS memory. The process is quick and takes approximately 5 seconds to configure. A typical hand connection and configuration would take up to 5-10 minutes of a technician's time, and subject to human error. A single wrong value entered in the display scale factor can affect the accuracy of your readings.
The IMP500 simply reads the TEDS sensor and configures its internal parameters. It is possible to program your own TEDS sensor using the IPM500 software. It's a windows based applications that allows management of the display and programming of TEDS sensors. Other functions include data logging capabilities and also auto configuration of non-TEDS sensors through a data file management system.
Figure 5 shows the basic interface that allows Taring and Peak and Valley capture of data.
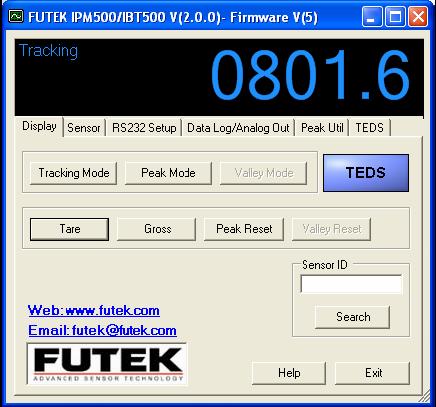
Figure 5The TEDS data entry Figure 6 is a simple Windows form with pull down menus to simplify data entry and changing calibration values on the fly.
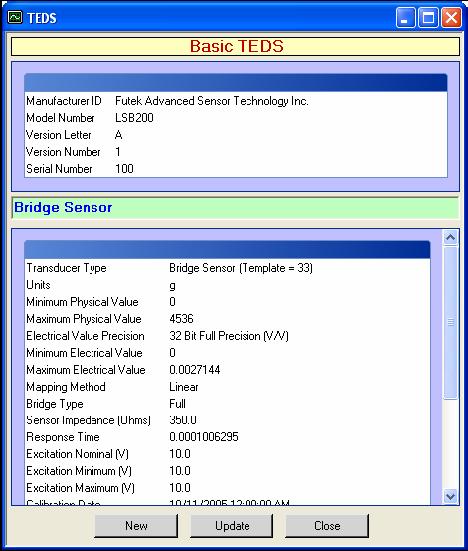
Figure 6Conclusion TEDS has simplified many aspects of setting up sensors. No longer will engineers or technicians have to guess what sensors connections are needed due to lack of proper documentation or knowledge. So many things can go wrong when setting up a sensor with a display or other system. Bad connections can simply cause noise or actually damage your sensor and electronics. Bad data entry can cause problems that may even go undetected, until a customer questions the accuracy of the sensor. This is true if your scale factor is off by a fraction, where a test may look normal since your scaled output will be too close to discern any anomalies. But with its benefits will also be issues. Legacy sensors will all have to be upgraded, which will require costly assembly and recalibration. Specific information for a sensor may not be supported by the standard templates. Even with TEDS, user will still have to keep paper copies of calibration certificates for auditing and traceability purposes. Manufacturers will have to come to agreement on physical connections to keep them as standard as possible.
References:
[1] Torben R. Licht, Bruel & Kaer Sound & Vibration, Denmark. The IEEE 1451.4 Proposed Standard And Emerging Compatible Smart Transducers and Systems. Online. Internet. Available: http://ieee1451.nist.gov/Proposed%201451.pdf
[2] John Mark, Kistler Instrument Corporation And Paul Hufnagel, Kistler Instrument Corporation Secretary, IEEE 1451.4 Standard Working Group The IEEE 1451.4 Standard for Smart Transducers. Online. Internet. Available: http://standards.ieee.org/regauth/1451/IEEE_1451d4_Standard_Genl_Tutorial_090104.pdf
[3] IEEE 1451.4 Sensor Templates Overview. Online. Internet. Available: http://zone.ni.com/devzone/conceptd.nsf/webmain/2B71D966B0E41FB586256D9B0068BCBC
|
|
| Home | About Us | Back To Technical Library | Contact Us |
|
Copyright © 1996-2010 JobShop.com. All Rights Reserved. General or Technical Questions? E-mail support@JobShop.com |